
Recurrence Analysis Function (ReAF): A description of the ReAf can be found in the concurrent article Hoenen (2018).
The main goal of this visualisation is to use textual redundancy to characterise the mode of text genesis as either born-oral (bardic) or born-written.
Even though a non-standardised orthography can obscure redundancy, the concurrent analyses on the basis of the lemmata of the texts have (just as the wordforms) not made any other conclusion probable than the one that Donelaitis' texts are born-written.
ReAFs:
Pavasario linksmybės,
Vasaros darbai,
Rudenio gėrybės,
Žiemos rūpesčiai,
Fortsetzung,
Pričkaus pasaka apie lietuvišką svodbą,
Lapės ir gandro česnis,
Rudikis jomarkininks,
Šuo didgalvis,
Pasaka apie šūdvabalį,
Vilks provininks,
Aužuols gyrpelnys
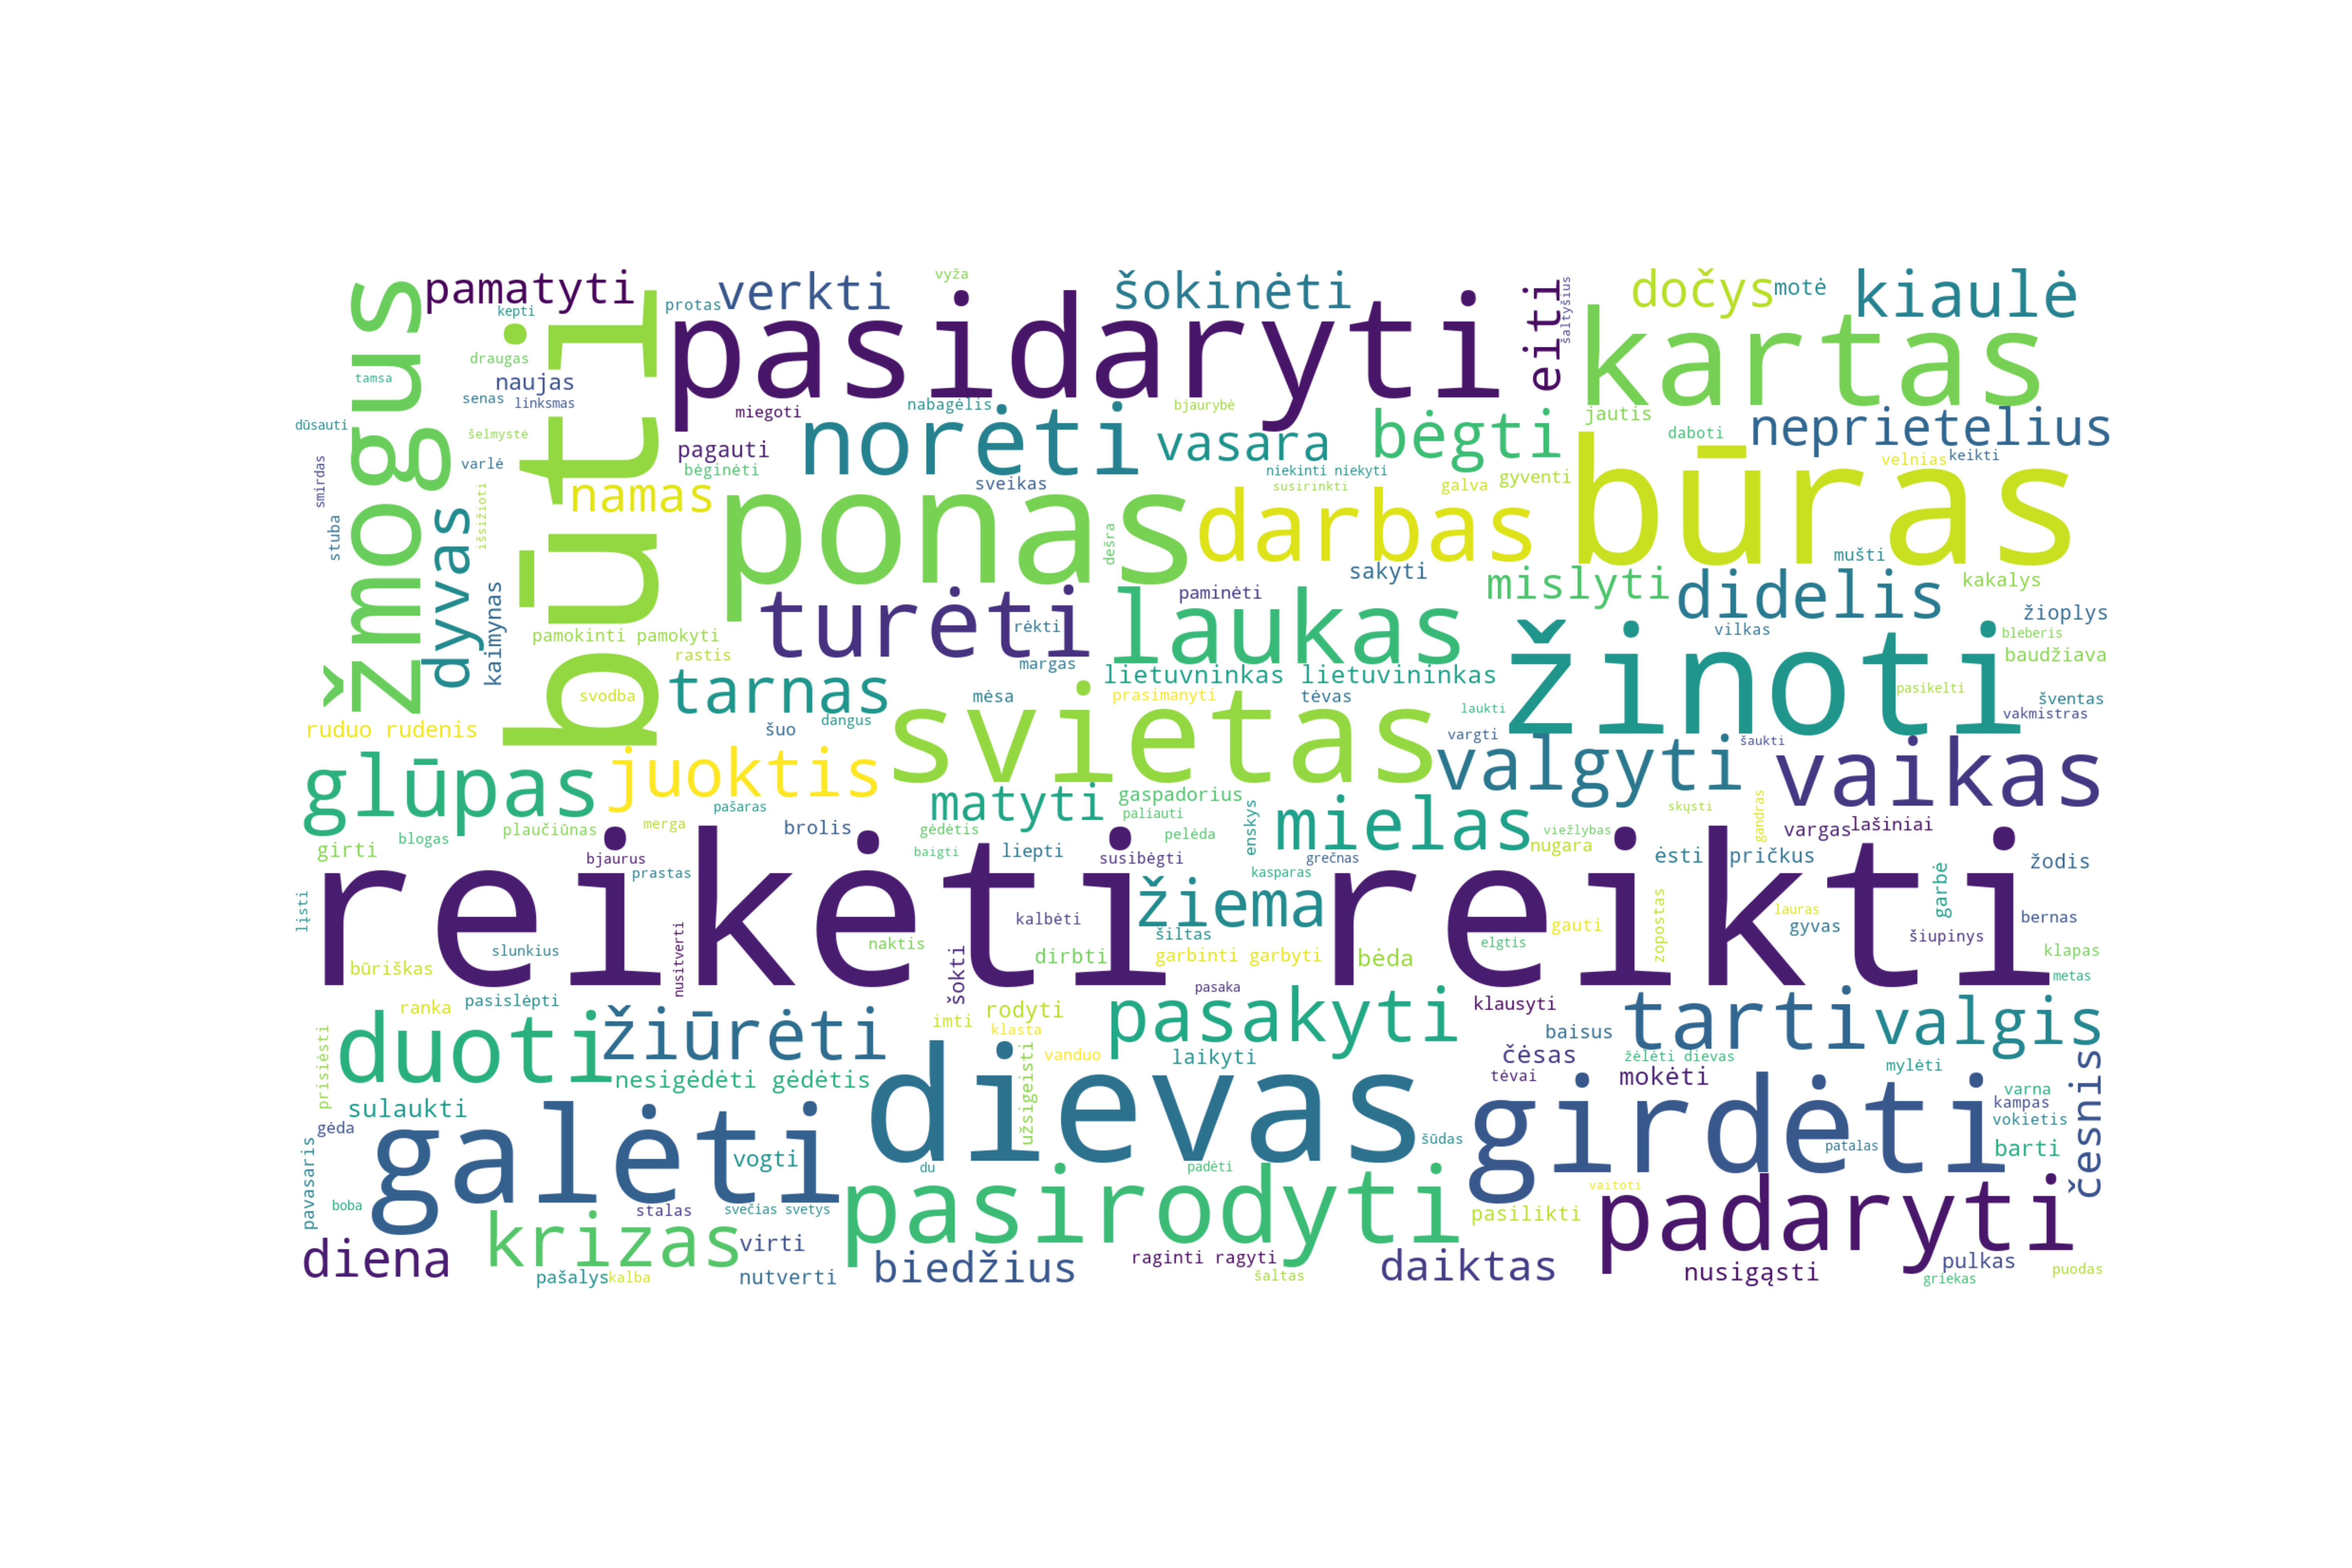
Word cloud: A word cloud counts as one of the most popular visualisations in digital space. It allows for an approximate impression of the textual content through the rendering of its most frequently ocurring word forms.
This word cloud is based on the lemmata of the texts whilst all positions with a non content-word part-of-speech tag have been excluded. The graphic was produced with Python.
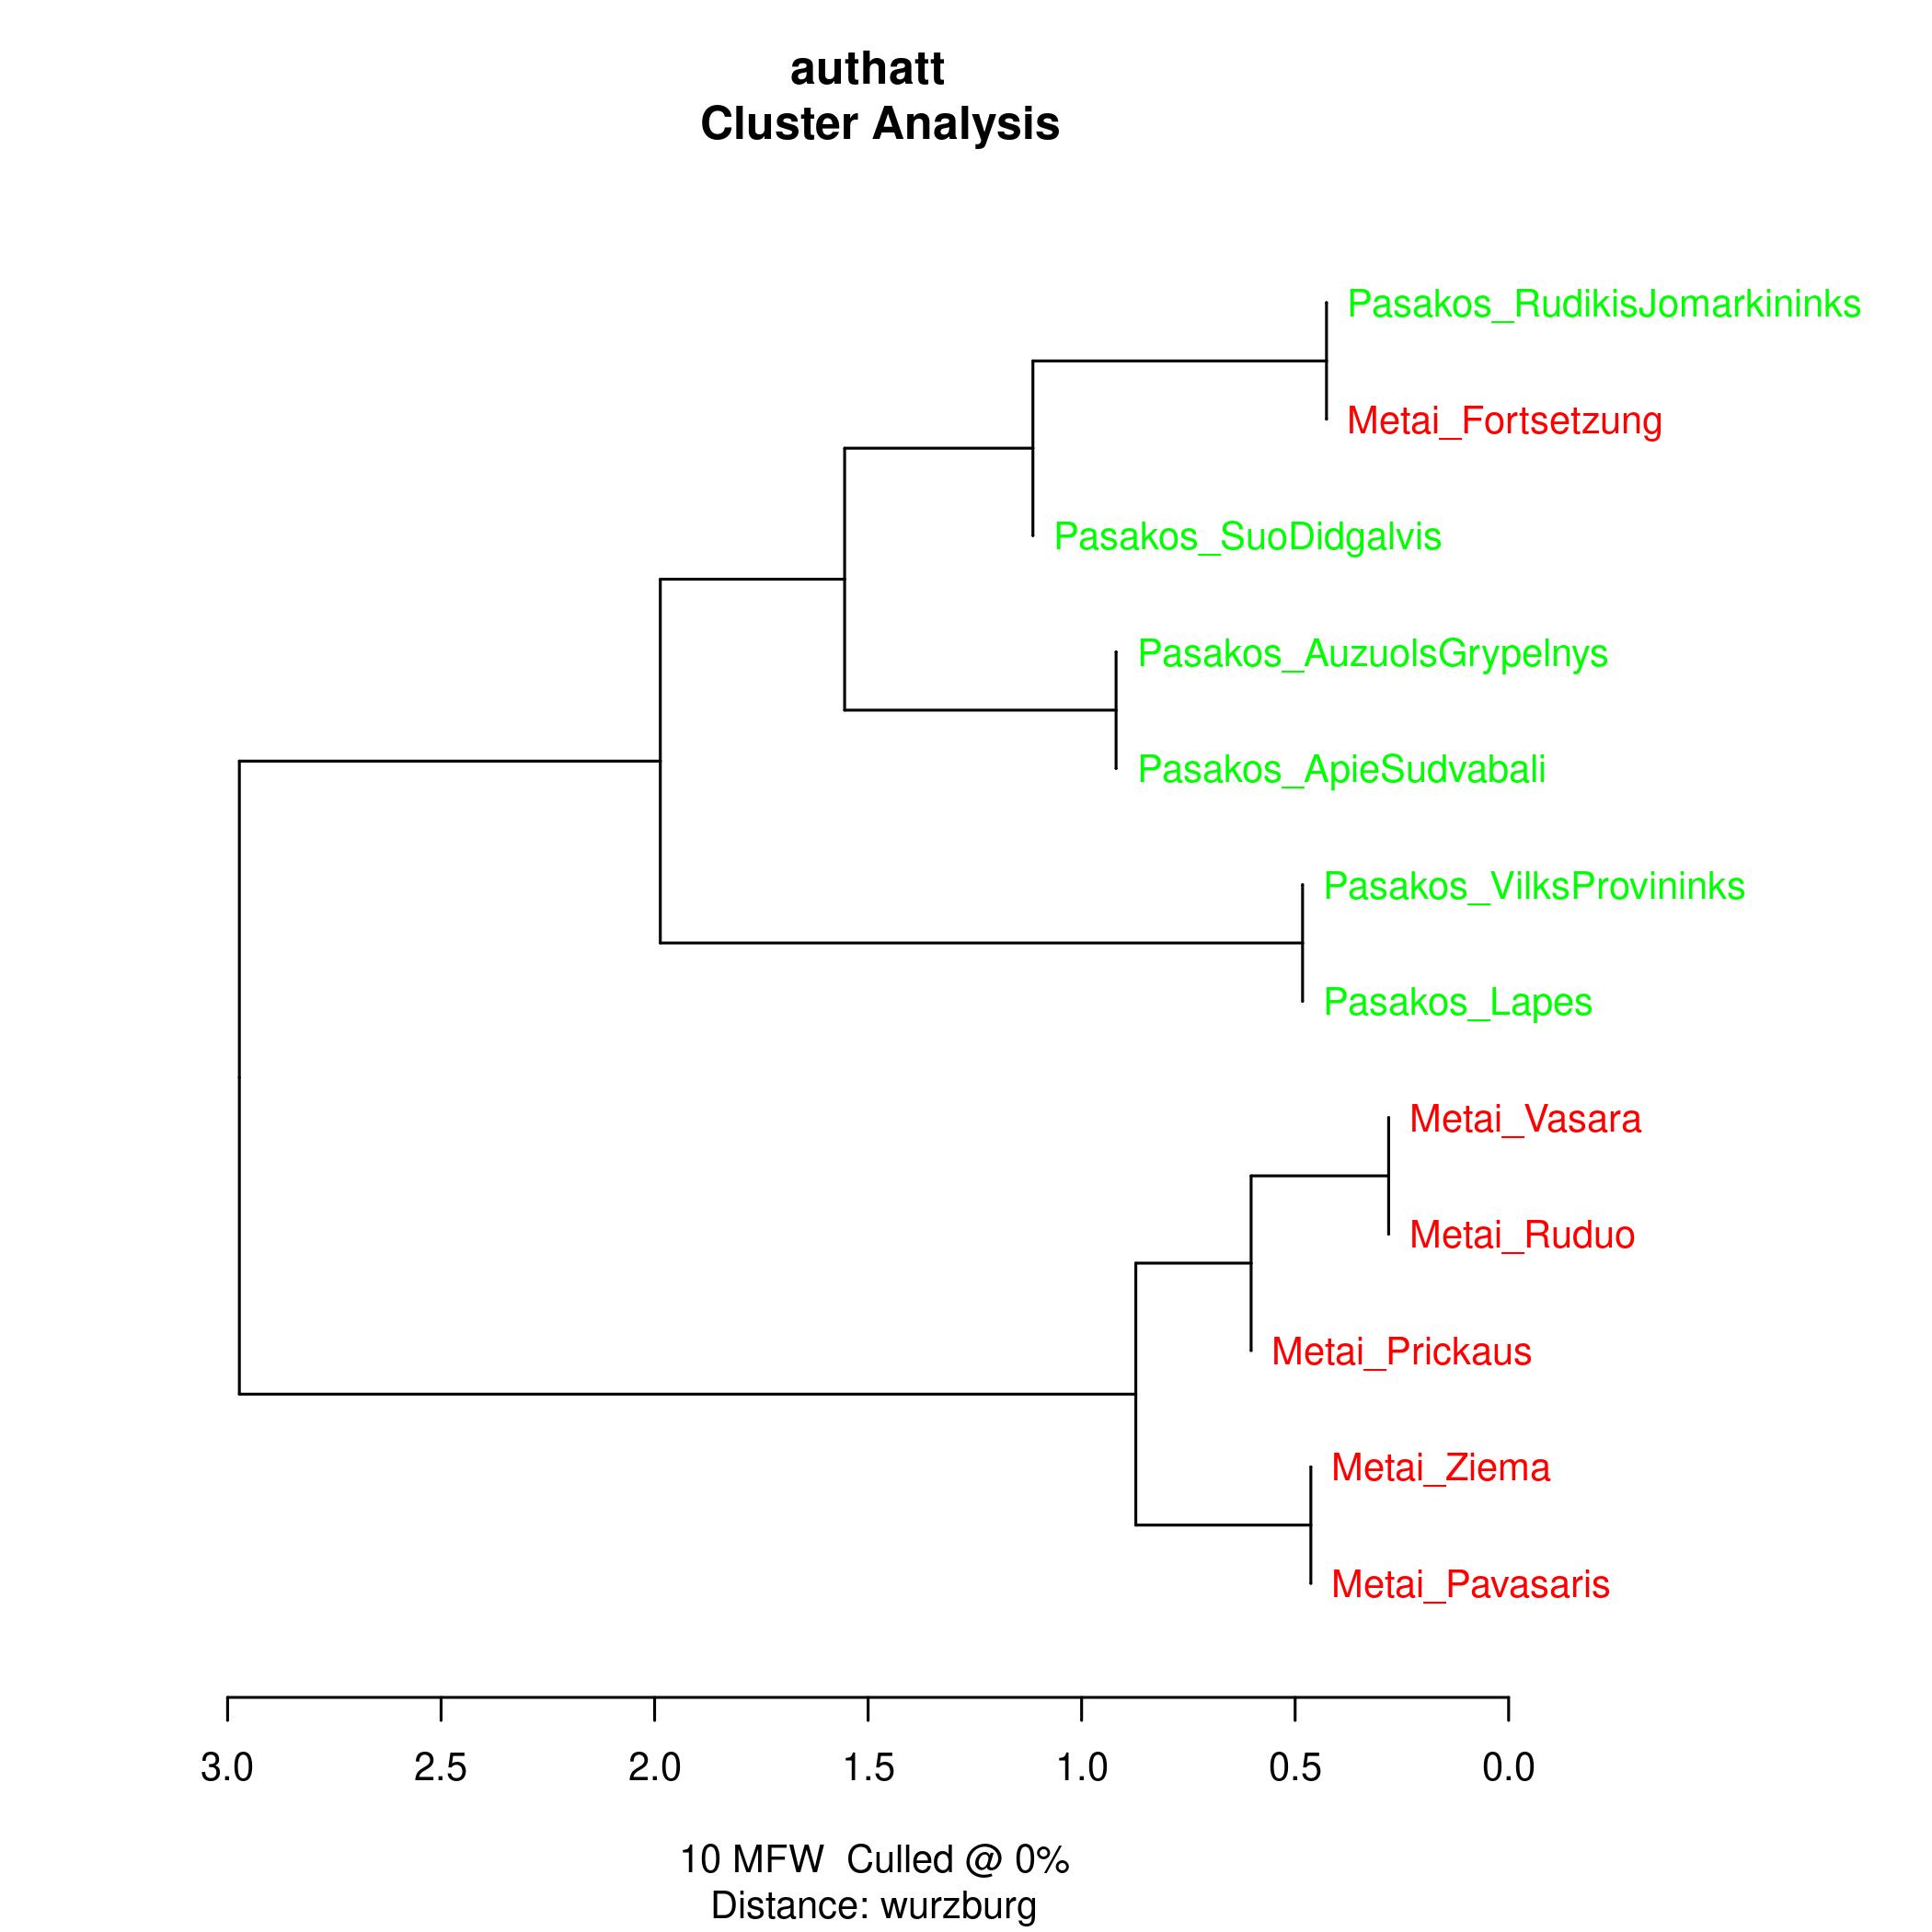
Stilometry: Stylometry analyses the styles of different authors using under more statistical characteristics of their texts and has generated public attention when contributing to cases of attribution of texts of anonymous authorship to concrete persons.
In this case, we use the R package stylo in order to compute how similar the single texts appear to be to each other given the use of frequent words.
Generelly one can observe, that the fables and Metai are lying somewhat apart, but that Metai fragments show a tendency towards the fables. This could theoretically be influenced by text length.
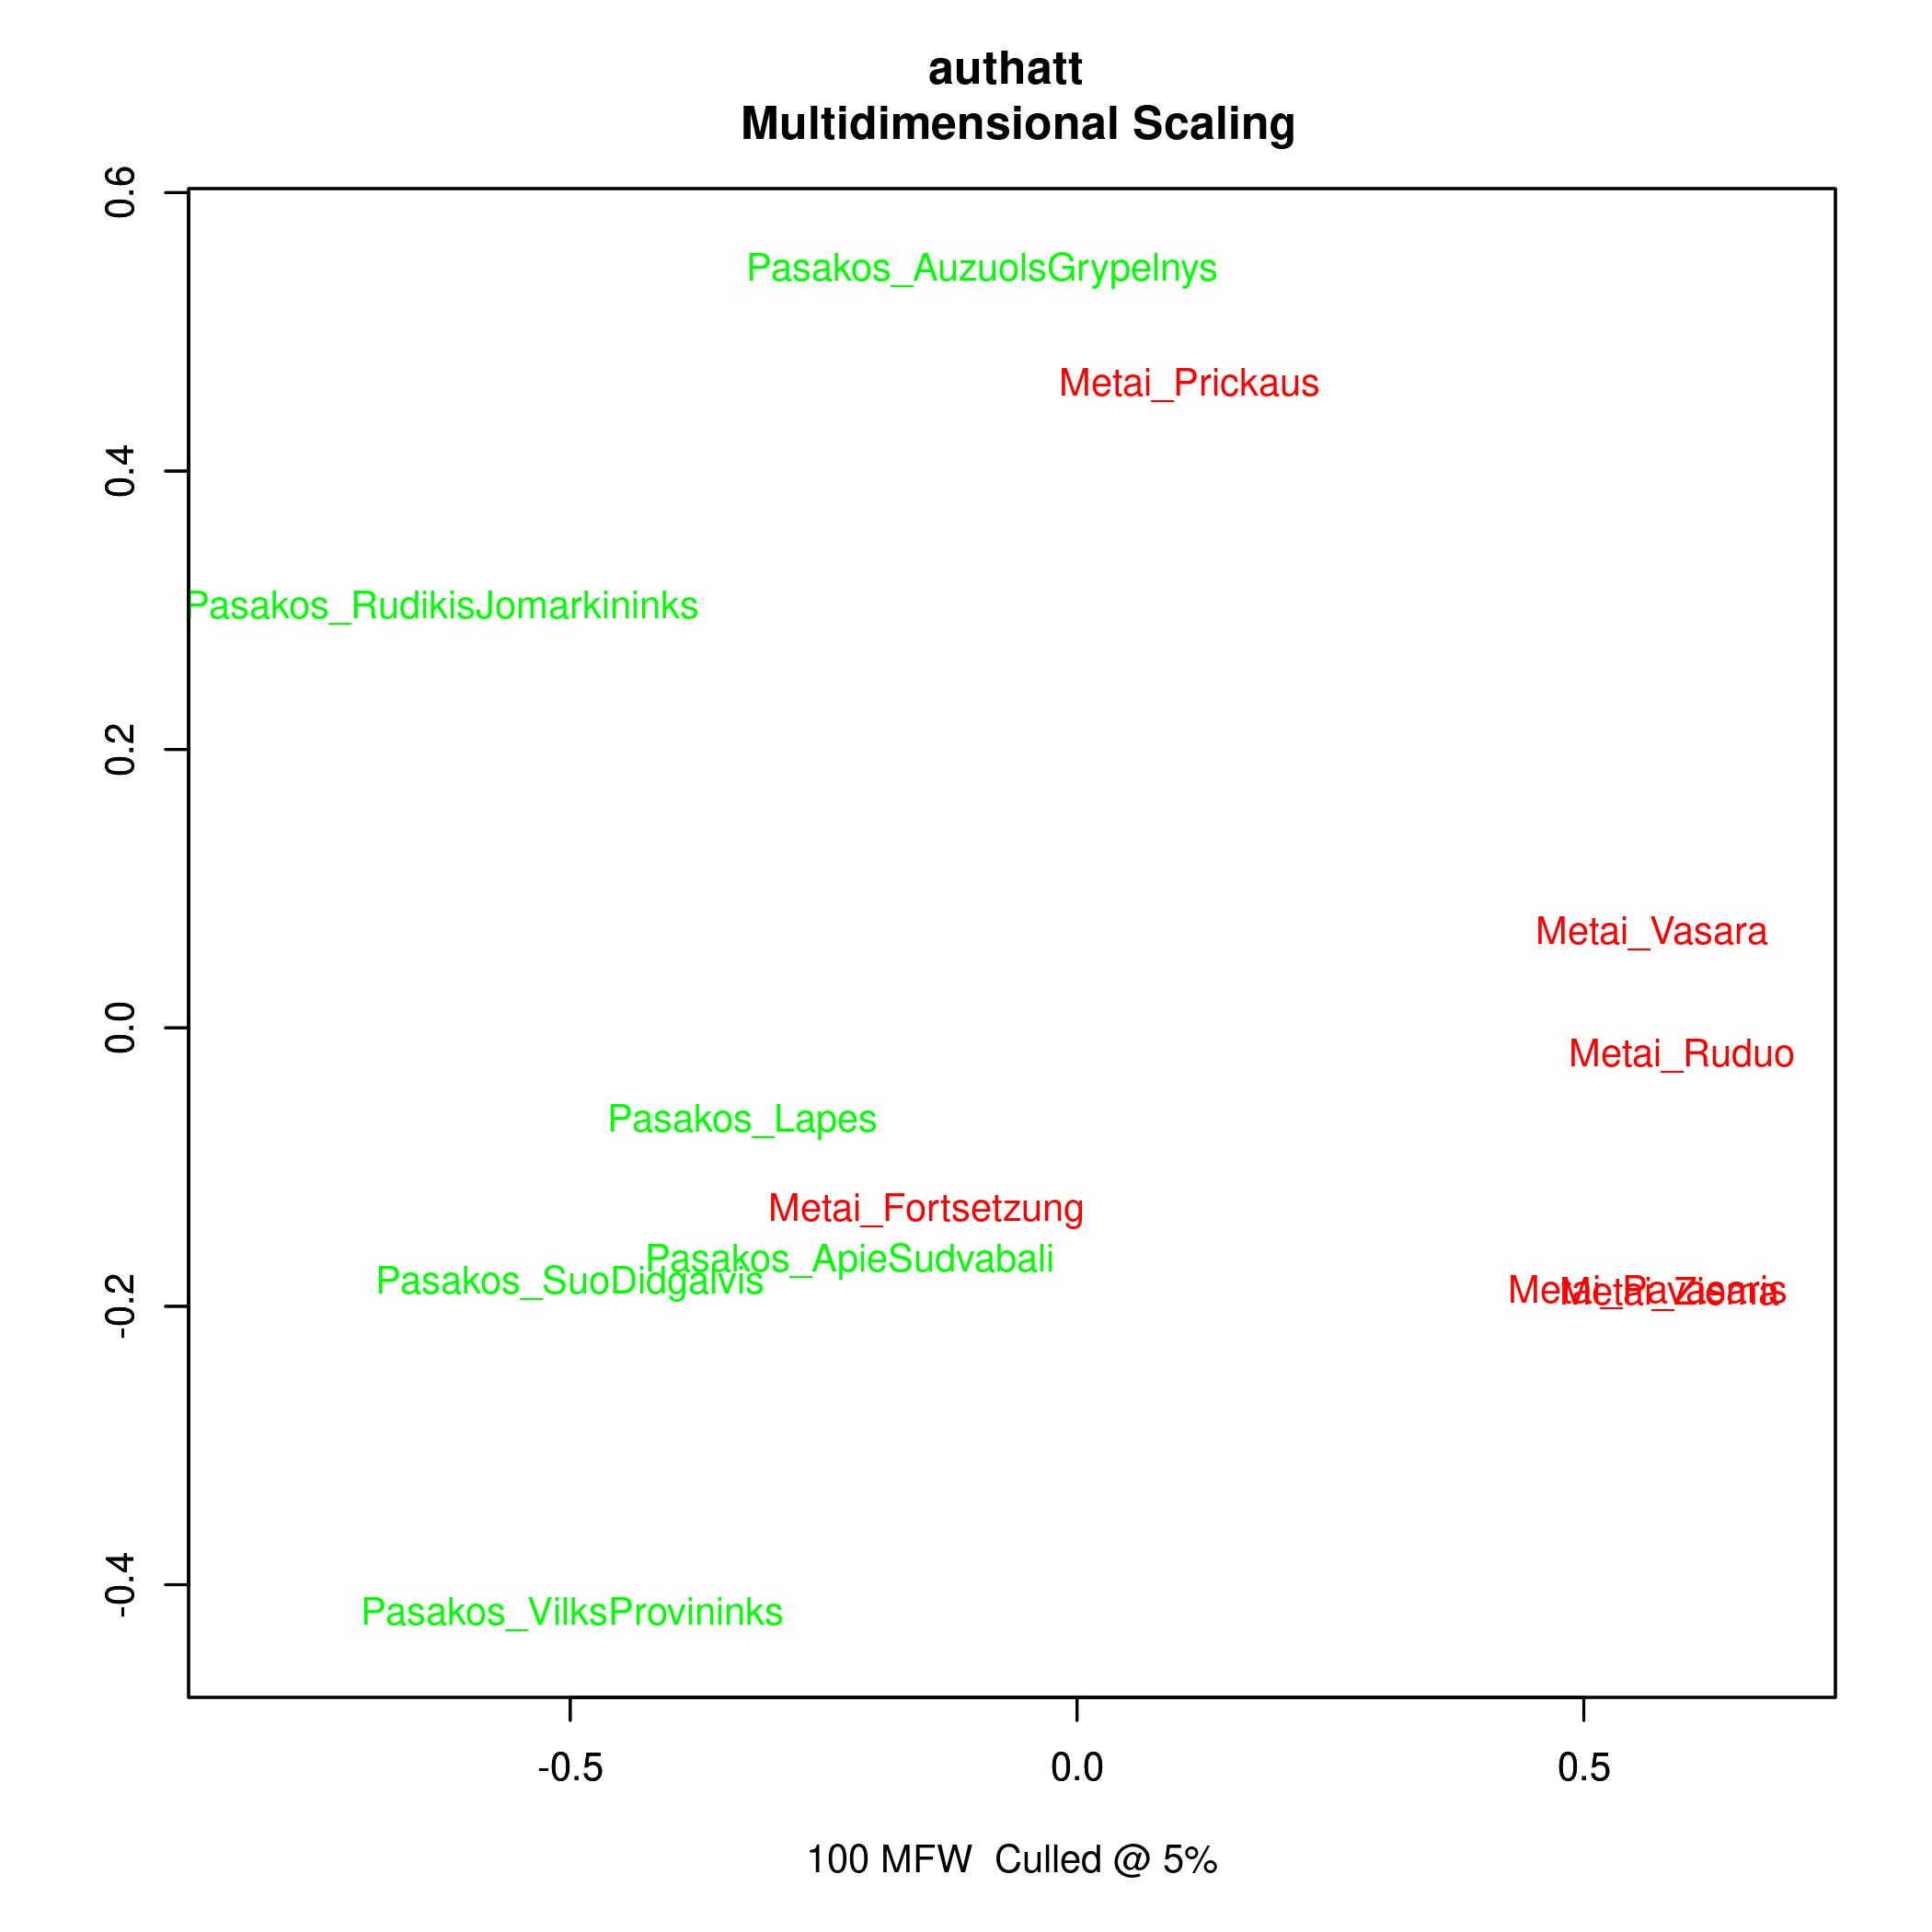
In using the most frequent words, similarities in content are usually not captured since the most frequent words are usually function words. In another view onto the same data (so-called multi dimensional scaling)
where texts are located within a 2-dimensional space according to their distances the interpretation seems similar. The tree does not change using more words.
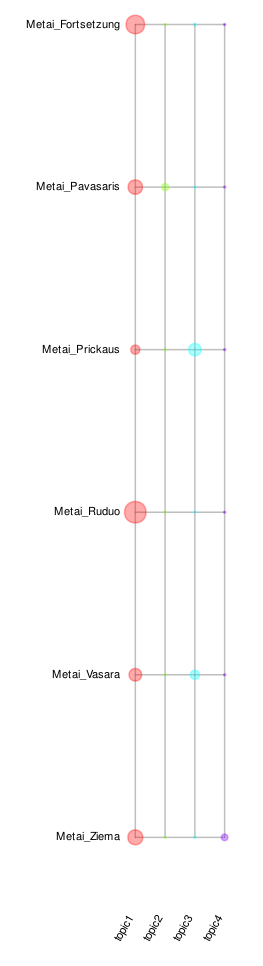
Topic Models: Topic models are a method which recognises word groups which are statistically similar in their distribution throughout the texts in a corpus. Such word groups are called topics in this technology.
In opposition to other technologies in topic models one word may belong to different topics, may indicate different topics with different strengths. The only parameter one needs to initialise a topic model is the number of
assumed topics within ones corpus.
Analysing the Metai (lemmata) assuming 4 topics, the following graphic can be produced. The topics here are characterised by the following word groups (only 10 most indicative terms per topic):
topic1: savo, būti, būras, ponas, dievas, reikėti, žinoti, pasidaryti, kartas, padaryti
topic2: pulkas, lėlė, austi, kopinėti, nuogas, oras, vanduo, skranda, padėti, trūsas
topic3: krizas, česnis, šventas, matyti, enskys, bjaurus, ranka, svodba, stalas, šokti
topic4: amtsrotas, varna, kakalys, šiltas, šaltyšius, mylėti, metas, klastuoti, žiemys, tamsa
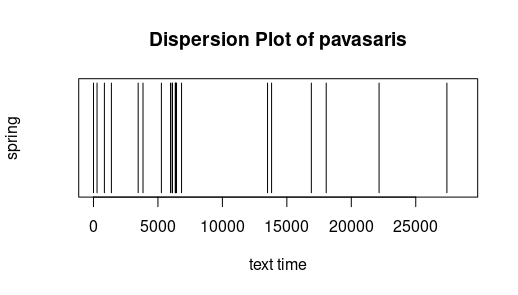
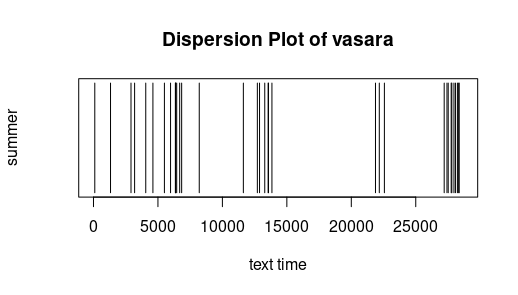
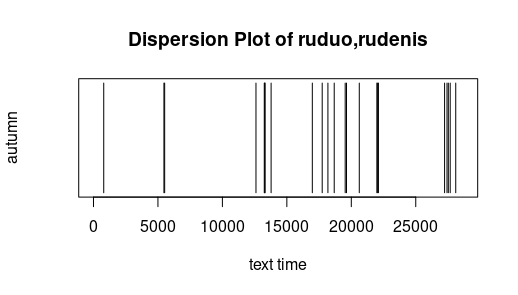
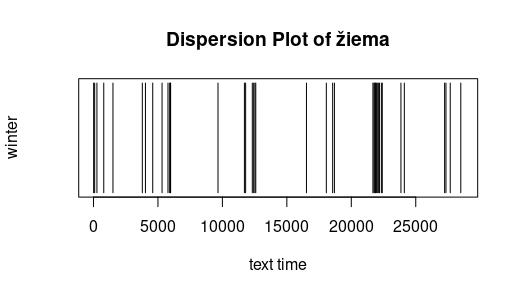
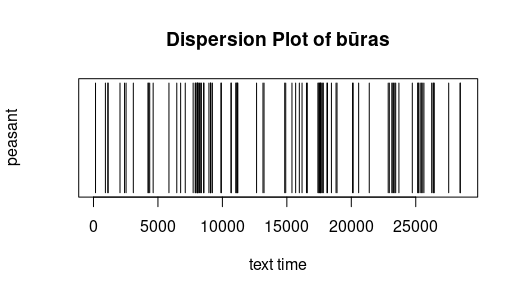
Dispersion: The following simple graphics display where a certain word appears. The x-axis has the "text time", that is with every token (punctuation mark or word) the text time increments.
The 100st token has thus text time 100. Text of the investigation was Metai (without Pričkaus pasaka). One sees that the peasant is active throughout the entire year, and that the seasons are not only mentioned in their
respective chapters. Free after Jockers (2014).

 |
|  |
| 